Search Waypoint Resources
Customer Success & Financial Linkage
How much revenue is at stake?
Customer Success & Financial Linkage FTW.
View your customer sentiment in terms of revenue.
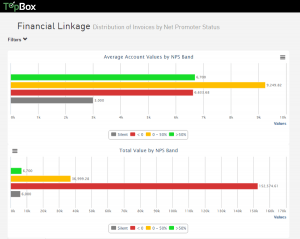
The top bar graph shows the average amount of money spent by Promoters, Detractors, Passives and, that commonly ignored NPS® band, Non-Responders.
Here, Passive accounts — those who give you a “meh” — are spending the most on average, which could spell danger if you don’t wow them soon. Promoters and Detractors are paying similar amounts, what could be the reason behind their wildly different success outcomes?
The second bar graph here shows how much total revenue is at risk, and this isn’t a pretty picture. The sum of revenue paid by Detractors is through the roof compared to any other bracket!
Accounts that total more than $150k in revenue for the month are upset and need immediate attention.
Next steps: Look at the individual accounts within this segment to understand which key drivers are bring scores down. Close the loop with these Detractor accounts before they churn and take all that $$ with them.
Research is our middle name – literally. (Waypoint Research Group, to be exact.)
